SciGen Teacher Dashboard
Unit L1
Populations in Balance
 Lesson: A Chesapeake Bay Food Web
Duration: Approximately 70 minutes
Through the story of the Chesapeake Bay oyster, learn about the ecosystem's food web in this illustrated guide.
LEARNING OBJECTIVES
Students analyze and interpret data to provide evidence for the effects of resource availability on organisms and populations of organisms in an ecosystem.
Students construct an explanation that predicts patterns of interactions among organisms across multiple ecosystems, especially competitive, predatory, and mutually beneficial interactions.
Students construct an argument supported by empirical evidence that changes to physical or biological components of an ecosystem affect populations.
Teacher Tune-ups
Teaching Notes
ACTIVITY OVERVIEW
- Set the context for the activity (10 minutes)
- Meet the heroic Chesapeake Bay oyster! (10 minutes)
- Explore a Chesapeake Bay food web (20 minutes)
- Review the activity (10 minutes)
- Optional extension: Statistics (20 minutes)
Set the context for the activity (10 minutes)
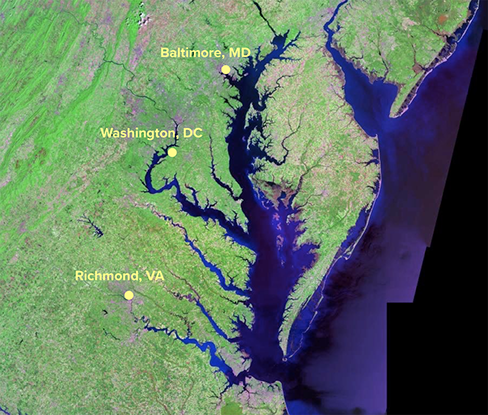
Paraphrase:
The Chesapeake Bay is the largest estuary in the United States. The bay’s health is not good, but communities near the bay in Maryland and Virginia are trying to turn things around. They are doing all kinds of things to remind people about ways to keep the bay water cleaner.
Display and discuss slides.
Meet the heroic Chesapeake Bay oyster! (10 minutes)
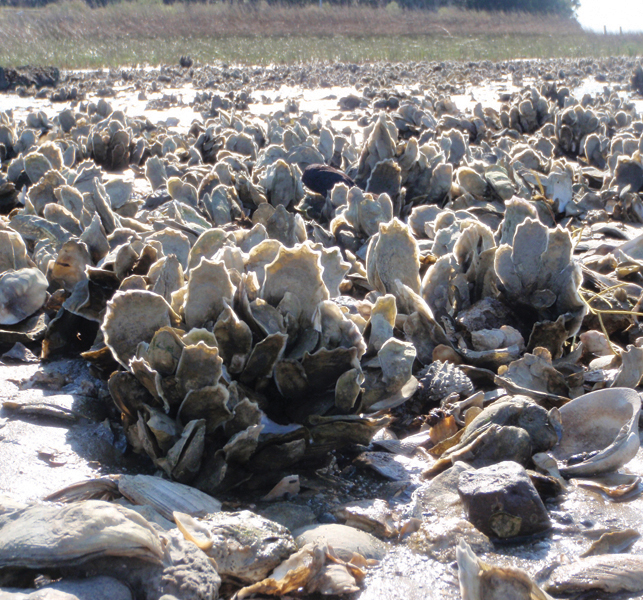
Display slide #1 (Image of Eastern Oyster by Roman Crumpton, U.S. Fish and Wildlife Service).
Paraphrase:
Communities near the bay in Maryland and Virginia are doing all kinds of things to remind people about ways to keep the bay water cleaner. They really want the oysters in the Chesapeake Bay to thrive again like they did many years ago.
Why is a little oyster such a big deal?
Oysters filter water through their systems in order to feed on microscopic floating plants and animals called plankton. But as the oysters filter the water for food, they also make the water clearer. With clearer water, sunlight can shine through the water and nourish more plants in the water. With more sunlight, the plankton population is healthier, so the oysters have enough to eat. It’s a great example of interdependence.
Display slide #2 and paraphrase:
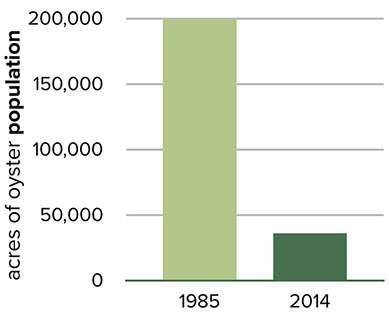
However, the oyster’s population has declined. Some say it’s because fishermen are taking too many. Others say it’s because of pollution. Scientists think the problem is a combination of many factors.
The area of the bay populated with oysters used to be 200,000 acres. Now the area is reduced to about 36,000 acres. Some estimate that many years ago oysters could filter the bay in four days. Now it takes 325 days.
Explore a Chesapeake Bay Food Web (20 minutes)
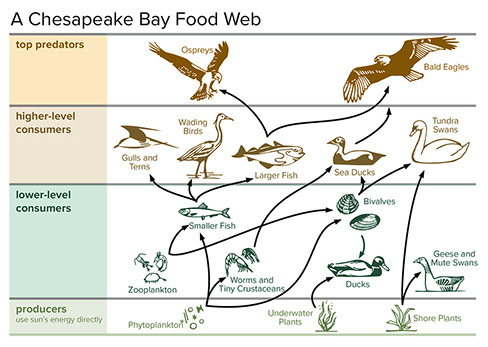
Paraphrase:
Why is the oyster’s job so important?
Oysters are shown in the food web above in the bivalves group. Oysters not only eat plankton, they also make the water better for plankton. Above you can see two types of plankton that many other animals depend upon. Zooplankton are tiny animals and phytoplankton are tiny plants.
Looking at the Chesapeake Bay Food Web above, use the arrows to trace a single food chain. Then fill in the chart.
Display and discuss slide.
Ask:
Why is the oyster’s job so important?
Paraphrase:
Oysters are shown in the food web here in the bivalves group. Oysters not only eat plankton, they also make the water better for plankton. You can see two types of plankton that many other animals depend upon.
Zooplankton are tiny animals and phytoplankton are tiny plants.
Have students to discuss with a partner:
What problems could occur if there were not enough of those little oysters?
Ask:
Imagine that the water were too cloudy for the sun to reach the plankton and the submerged aquatic vegetation. Could this affect a top predator such as the osprey or the bald eagle?
Review the activity (10 minutes)
Optional extension: Statistics (20 minutes)
Don't Let Statistics Mislead You
This activity asks students to examine the storm drain pollution in the Chesapeake Bay. Data is provided that shows the percentage of pollution in the bay from each state.
A student could look at the data and conclude that Delaware and D.C. do a much better job of keeping storm pollution out of the bay than Maryland and Virginia. This conclusion involves faulty thinking. Even though Delaware and D.C. are both responsible for a smaller percentage of the pollution, they are much smaller areas. One would have to look at the proportion of the land that these areas occupy in order to determine whether or not they are better at keeping storm pollution from entering the bay.
Paraphrase:
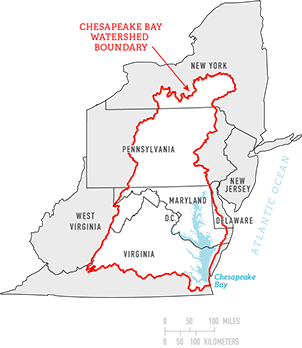
The white area on this map represents the area of land that drains into the Chesapeake Bay. This area is called the bay’s watershed. This part of the United States has large population centers with paved roads. When rainwater flows from these roads and eventually reaches the bay, it contributes to the disturbance of the bay’s ecosystem.
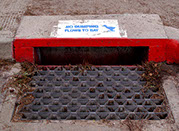
In an attempt to help the bay recover, cities like Baltimore and Washington label storm drains to remind people not to dump pollutants.
The chart shows what percentage of the storm drain pollution in the bay comes from each area.
Consider this: You hear a student who looked at these data say, “Delaware and D.C. do a much better job keeping storm pollution out of the bay than Maryland and Virginia!”
There is a MAJOR problem with this student’s logic. What is it? What would you say to help someone understand that looking at the percentages alone could be misleading?
BETA Version - Please send comments and corrections to info@serpinstitute.org
