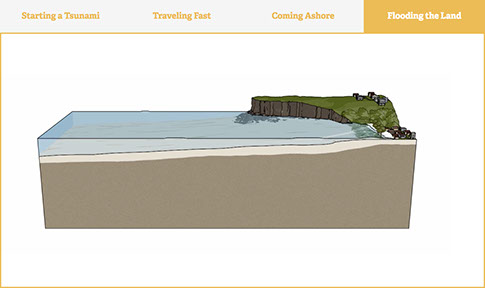
SciGen Teacher Dashboard
Unit E4
Making Waves
Conversation: Waves of Danger
Duration: Approximately 60 minutes or more
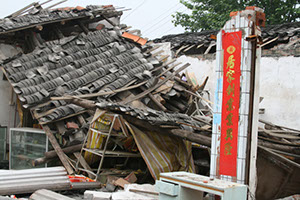 In this activity, students look at maps and statistics from deadly earthquakes in recent history to consider what factors make some earthquakes more lethal than others. They end by proposing how a government could spend its earthquake preparedness budget to save lives.
LEARNING OBJECTIVES
Students examine and interpret numerical and visual data.
Students analyze data to form an argument.
Teacher Tips
- Consider expanding this lesson to several days with more exploration of the measures humans are taking to survive earthquakes.
- An interesting historical perspective is included in the PBS program NOVA, "Secrets of the Forbidden City," which explores how this ancient architectural marvel has withstood centuries of seismic activity. It may be enough to share this quick 30-second teaser with your students to look for clues, but if you are able to get your hands on the full program and have the time to watch it, share the whole video.
- Consider accompanying this activity with the use of a shake table and an accompanying hands-on project. Many examples of lesson plans with shake tables exist online, such as the Exploratorium Teacher Institute and Teach Engineering.
Materials
- optional: chart paper for brainstorm
- optional: sticky notes for brainstorm
Safety Check
- All students react to natural disaster threat differently. Use your judgment about the appropriateness of sharing media of natural disasters with your particular students, given their age, maturity, experiences, and vulnerability. The lesson includes data, photos, and animations of earthquakes and tsunamis. These could trigger some of your more sensitive students, especially those with personal connections to disaster. Teachers who seek out and share live-action video of a real earthquake or tsunami, such as archival news footage, should consider watching it with the sound off to protect more sensitive students, or give individual students the option to watch or not.
Teacher Tune-ups
Teaching Notes
ACTIVITY OVERVIEW
- Set the context: earthquake aftermath (15 minutes)
- Look at maps and charts (20 minutes)
- Illustrate tsunamis (15 minutes)
- Conversation: brainstorming safer solutions (20 minutes)
- Review the brainstorm (10 minutes)
Set the context: earthquake aftermath (15 minutes)
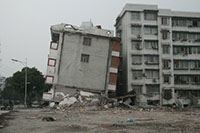
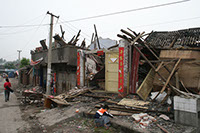
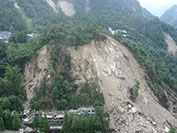
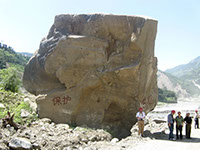
Display and discuss five slides of the 2008 Great Sichuan Earthquake.
Paraphrase the following.
Today we are going to think about how earthquake energy moves through the earth and translates into death and destruction.
In May 12, 2008, the Great Sichuan Earthquake, also called the Wenchuan Earthquake, rocked central China with a 7.9–8.0 magnitude. The epicenter was 80 km west-northwest of Chengdu, the capital city of Sichuan province.
China has the largest population of any nation, and many of its cities are very crowded. When a quake strikes, apartment buildings full of residents may crumble, killing thousands. In the Great Sichuan Earthquake, nearly 88,000 people died.
Notice how energy transfered from the earth into the landscape and the buildings. Traditionally, buildings in earthquake areas were built of wood because it is a more flexible building material.
(Note: Text above adapted from various pages of the United States Geological Survey, usgs.com.)
Optional: The PBS program NOVA has a fascinating documentary about how the Forbidden City has withstood centuries of seismic activity. It may be enough to share this quick 30-second teaser with your students to look for clues.
Because of higher population densities and the fact that buildings are poorly designed and constructed in earthquake regions, some parts of the world experience more damage and deaths.
Optional extension: Allow more time if you bring in an example of an earthquake and its damage in the United States. The U.S. Geolological Survey's Earthquake Hazards Program has live updates around the world including shake maps. The magnitude 6.9 Loma Prieta earthquake in California's Bay Area during the 1989 World Series is one with dramatic images and stories that will drive home the fact that earthquakes hit the United States as well.
Look at maps and charts (20 minutes)
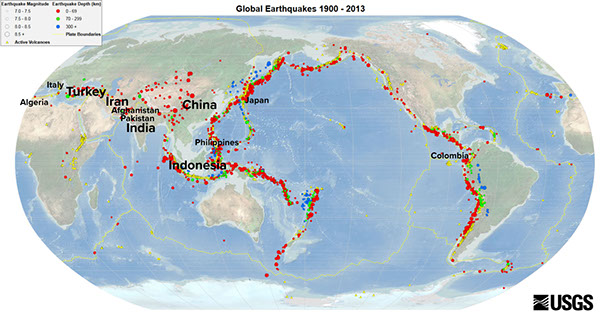
Show two maps: USGS's Global Earthquakes 1900-2013 and USDA's population density map 1994. Paraphrase:
Here's a map showing where earthquakes have been recorded in the years 1900 to 2013. Two countries that have frequent, deadly earthquakes are China and India, and those two countries together also have about one-third of the world's population. The countries that had more than four of the deadliest earthquakes from 1970–2011 have their names written slightly larger in both maps.
The next map shows the population density in 1994, which is similar to today. The darker the red color, the more people who live within a small space, and the very densest areas are shown in hot pink.
Break up the class into groups of four and have them all look at the maps and charts and have them come up with some of their observations and conclusions. To guide their observations, ask questions like:
What do you observe when comparing the two maps?
What do you observe about the countries with the deadliest earthquakes? (Those countries' names are in a larger font.)
What areas of the map have a high population density and a high frequency of earthquakes? What areas of the map have a LOW population density and a high frequency of earthquakes?
Is there any pattern relating the location of earthquakes and population density?
Have groups share out their findings and compare conclusions from group to group.
There are some areas that coincidentally have high population density and frequent occurrence of earthquakes. High population density does not cause earthquakes, of course! Make sure your students don't walk away with a new misconception.
Share chart of earthquakes:
Take a look at the chart "Deadliest Earthquakes 1970–2010."
You can sort the columns by number or alphabetically. Compare the country names with the list of the most densely populated countries.
One of the deadliest earthquakes in history happened at the very end of 2004. Look at that very large and tragic death toll. Some estimates put the numbers as high as 280,000 people in 14 countries.
The table is sortable when you click on the headers, or you can access a Google sheet with the same data.
Optional extension: The map shows the “Ring of Fire” very clearly. You can make a connection between tectonic and volcanic activity with a lesson like USGS's Surrounded by Volcanoes.
Deadliest Earthquakes (1970–2011)
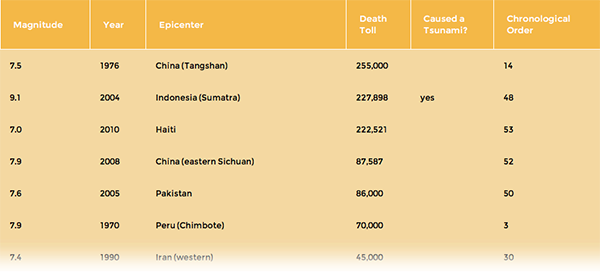
Note: Data table adapted from The Guardian's "Deadliest earthquakes since 1970."
Illustrate tsunamis (15 minutes)
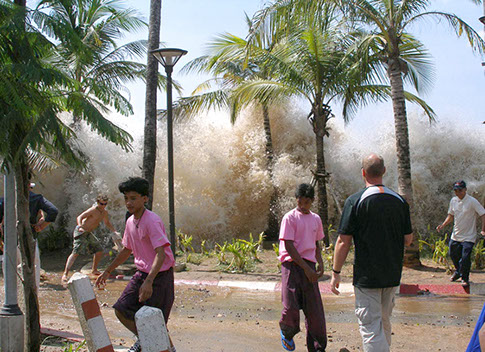
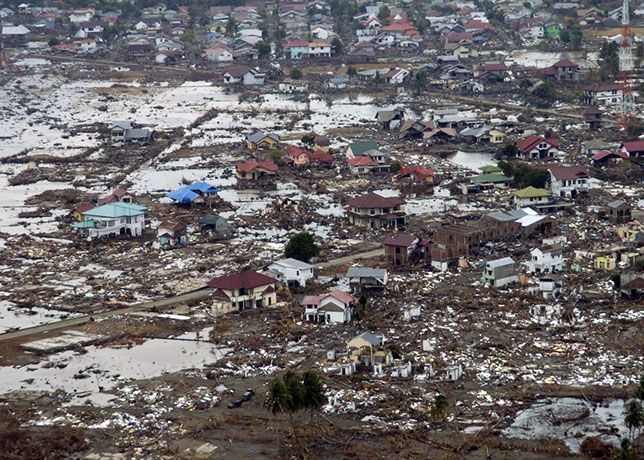
Show animations and photos of the 2004 tsunami. Paraphrase:
The main reason for the high death toll in 2004 was the tsunami the quake caused. A tsunami is a very large wave often made by an earthquake. This one rose 100 feet (30 meters) high.
While more than half of the casualties happened in Indonesia, countries far away from the epicenter of the earthquake lost lives. The tsunami took two hours to get to Thailand, where 5000 people died in its waves (mostly on the resort island of Phuket), and to Sri Lanka, where over 35,000 people died. Among the lucky survivors in Indonesia, Sri Lanka, and India, over 1.5 million people were forced to move after their homes were destroyed.
Tsunamis are large, potentially deadly and destructive sea waves, most of which are formed as a result of earthquakes below the surface of water. They may also result from the eruption or collapse of island or coastal volcanoes and the formation of giant landslides at the edge of the sea. These landslides, in turn, are often triggered by earthquakes.
Safety check: All students react to natural disaster threat differently. Use your judgment about the appropriateness of sharing media of natural disasters with your particular students, given their age, maturity, experiences, and vulnerability. The animations and photos could trigger some of your more sensitive students, especially those with personal connections to disaster. We were unable to find live-action video that is public domain or licensed for free use in schools that does not include the haunting screams of possible victims. If you do find archival news footage you would like to use, consider watching it with the sound off to protect your more sensitive students.
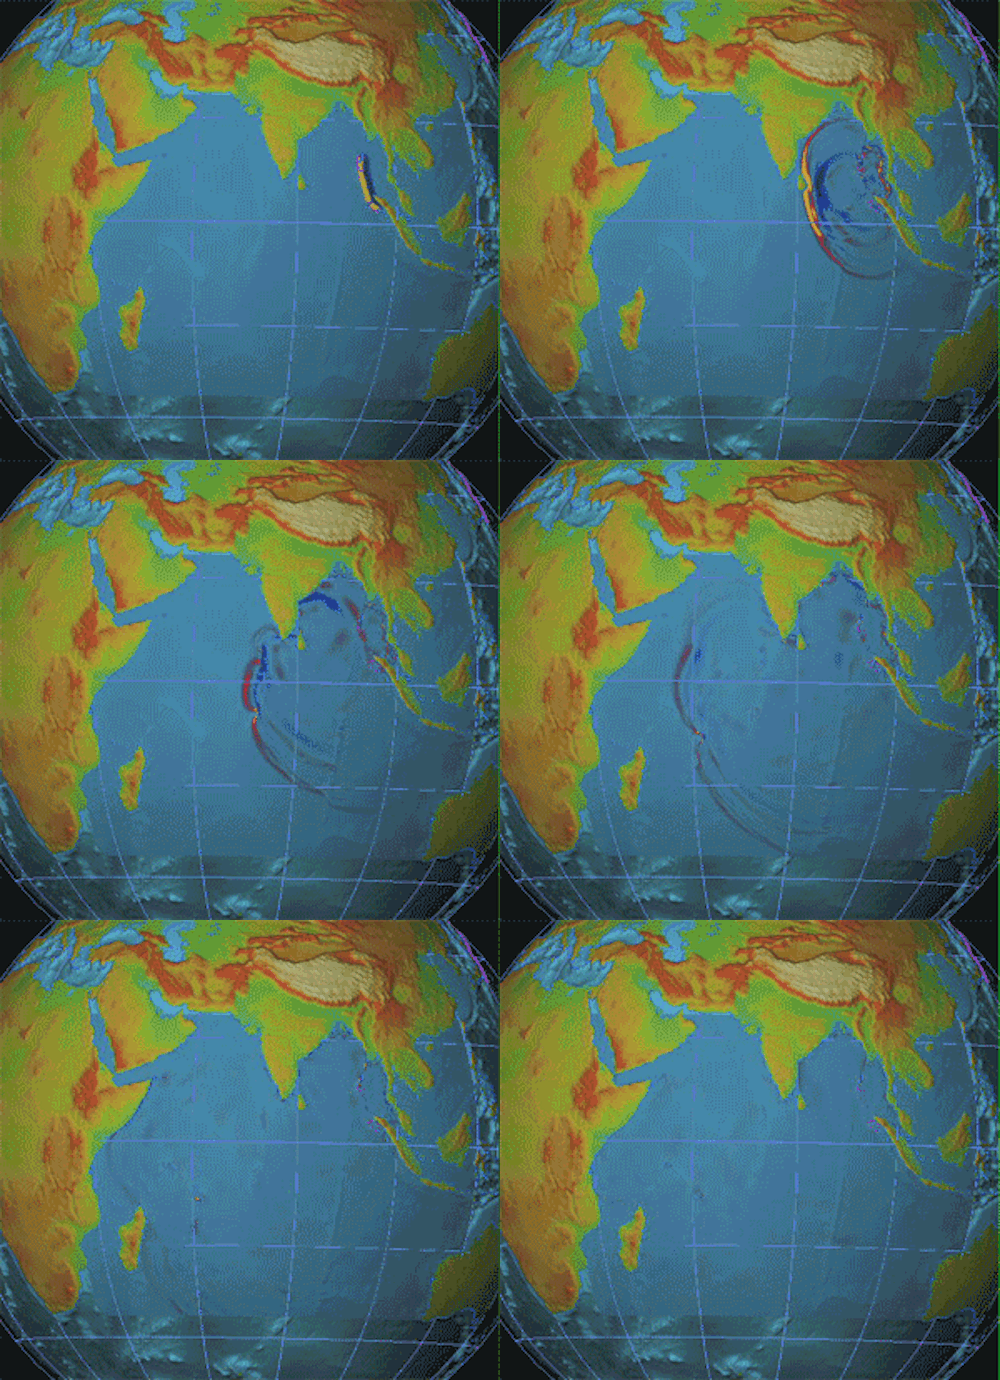
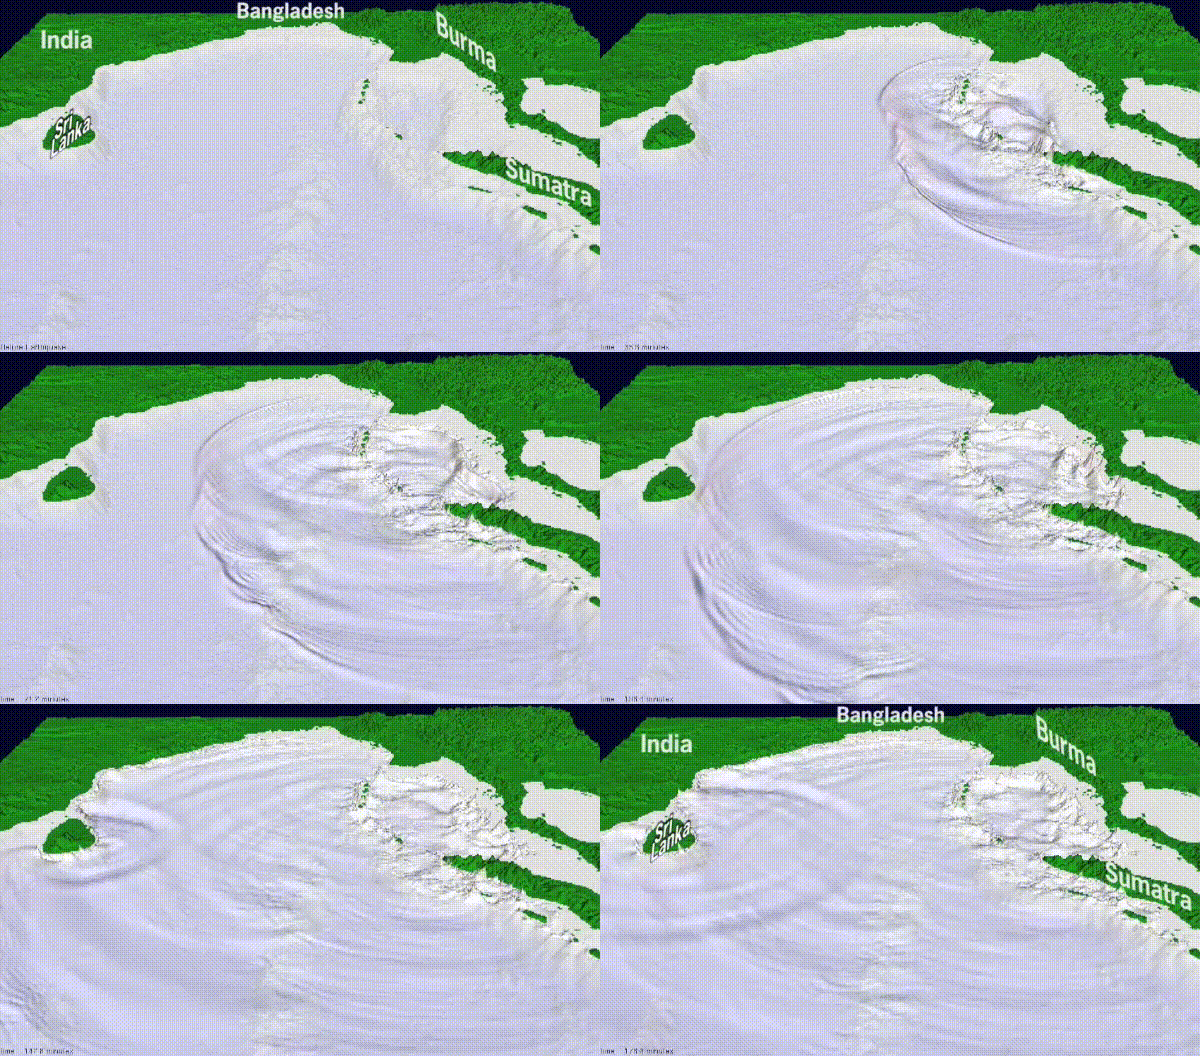
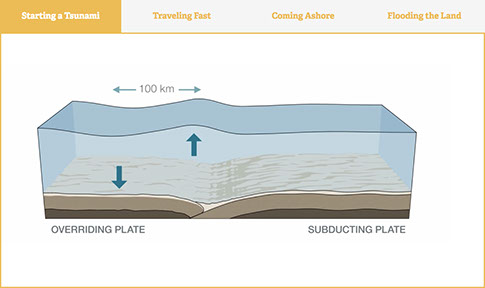
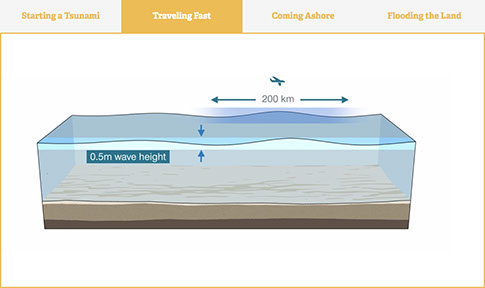
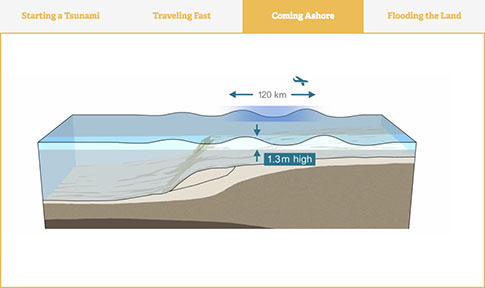
Display and discuss animations of tsunami formation.
Let's see a tsunami in action.
The first video shows the original event that generated the tsunami. When something like an earthquake or volcanic eruption pushes the water up or down, it shifts large volumes of water (miles of depth and a large surface area). That creates a big shift in the potential energy of the water in the ocean. The ocean surface falls and then rises again, as the surface returns to its original state. This back-and-forth movement creates a wave.
The second video shows the tsunami moving as fast as an airplane across the ocean.
The third video shows it "shoaling." Notice how the energy that is distributed throughout the deep ocean is tranfered into higher waves breaking on the shore.
The fourth video shows multiple waves coming ashore and going back out to sea.
Note: Animated tsunami videos used with permission. © Commonwealth of Australia (Geoscience Australia) 2017. With the exception of the Commonwealth Coat of Arms, and where otherwise noted, this product is provided under a Creative Commons Attribution 4.0 International License.
Conversation: brainstorming safer solutions (10 minutes)
Now groups within the class will independently brainstorm. Break the class into groups of three or so.
Paraphrase:
Shaking and collapsing buildings, landslides, tsunamis... there are so many reasons why earthquakes kill people near the epicenter and many thousands of miles away.
Imagine you are advising a Chinese tech multi-billionaire who lost a beloved uncle and cousin in the 2008 Great Sichuan Earthquake and two of her college friends in the 2004 tsunami. She's had enough, and she wants things to change! She wants to invest some of her money into reducing the devastating effects of earthquakes. Brainstorm projects, innovations, and campaigns you think would be an effective use of a billion dollars.
Ask students to spend some time making an argument for investing money in research, education, relocation, or improving cities to reduce the impact of future earthquakes. They should consider the data in the maps and chart as well as what they have learned about waves in this unit.
Explain to students:
Use information in this lesson as well as information from the prior sessions. It is also a great time to use your previous notes and the unit's focus words.
Possible ideas:
- an early warning system for quakes or waves
- an education program
- research into new architectural innovations
- simply relocating urban centers to new, more stable places
For ideas about how to run an effective brainstorm, you might consider learning about the design thinking methods championed by the Stanford d.school (Design School) and the company IDEO. Their seven rules for brainstorming are in the slide.
- Defer judgment (If you like/hate an idea, just keep it to yourself.)
- Encourage wild ideas
- Build on the ideas of others (Say, "That makes me think of…")
- Stay focused on the topic
- One conversation at a time
- Be visual (Use drawings to make your point.)
- Go for quantity
Adapted from IDEO U.
Review the brainstorm (10 minutes)
When the brainstorm is over and you review the concepts the students generated, use the Productive Talk Moves from SERP's program Reading to Learn Science. These tips will help you guide the discussion of the brainstormed ideas by encouraging individual students to share, expand, and clarify their own thinking.
Have one person in each group share their ideas with the class by writing their ideas on a large piece of chart paper or sticky notes on a wall. Seed the wall with three broad categories, such as: projects, innovations, campaigns. Or engineering, city planning, architecture, research. The categories can be expanded as ideas are added that don't fit into these categories, or to better define sub-categories.
The students will not have identified their best ideas during the brainstorm. As it ends, ask them to take a look at the ideas generated and choose some that they like, whether or not they came up with the idea.
For this review during which you expand and clarify the groups' brainstormed ideas, consider following the tips included in Productive Talk Moves from SERP's program Reading to Learn Science (RTLS). These tips will help you guide the discussion of the brainstormed ideas by encouraging individual students to share, expand and clarify their own thinking.
 Productive Talk Moves (RTLS)
Encourage individual students to share, expand, and clarify their own thinking.
1. Say More
“Can you say more about that?” “What do you mean by that?” “Can you give an example?”
2. Verifying and Clarifying by Re-voicing
“So, let me see if I’ve got what you’re saying. Are you saying...?” (always leaving space for the original student to agree or disagree and say more).
3. Wait Time
“Take your time; we’ll wait.”
Encourage students to listen carefully to one another.
4. Who Can Repeat?
“Who can repeat what Javon just said or put it into their own words?”
5. Explaining What Someone Else Means
“Who can explain what Aisha means when she says that?”
Press for deeper reasoning.
6. Asking for Evidence or Reasoning
“Why do you think that?” “What’s your evidence?”
“How did you arrive at that conclusion?” “How does your evidence relate to your claim?”
7. Challenge or Counterexample
“Does it always work that way?” “How does that idea square with Sonia’s example?” “That’s a good question. What do you think?”
Press students to apply their own reasoning to that of others.
8. Add On
“Who can add onto the idea that Jamal is building?”
9. Agree/Disagree and Why?
“Do you agree/disagree? (And why?)” “Are you saying the same thing as Jeyla or something different, and if different, how is it different?”
BETA Version - Please send comments and corrections to info@serpinstitute.org
