SciGen Teacher Dashboard
Unit E4
Making Waves


Lab: Sound Stations
 Duration: Approximately 50 or more minutes
In this activity, students deepen their understanding of waves in a series of quick experiments focused on the mechanical nature of sound. They use a special combination musical keyboard and oscilloscope to examine the nature of waves.
LEARNING OBJECTIVES
Students see that all sounds are caused by vibrations, and that these vibrations can be sensed through hearing, sight, and touch. They explore different instruments through which they discover the relationship between frequency or pitch and the rate of vibration. Students look at waveforms in a simulated oscilloscope.
Teacher Tips
- There are six suggestions below, and each station can take 7 minutes, more or less. You can set up as many as you'd like, or just pick one activity for everyone to try as a class. Each activity has a PDF of printable pages for the station's suggestions/instructions and recommended discussion questions.
-
Before class, make one cup-phone for Sound Station #4 to be reused by students, rather than having the students make their own at the station.
- Consider making cup-phones with Styrofoam cups or paper cups instead of plastic cups, changing the type of string to yarn, or twine, or even wire or fishing line, and the length of string – kids could explore whether those factors make a difference in the quality of the sound, or whether sound is carried better or not.
- If your students do not use lab notebooks, consider making a packet of questions for students so they can write more efficiently (and have it make more sense later).
- Slow things down by reducing the number of stations and adding time for each station for conscientious and grade-driven students who will likely miss out experiencing the phenomena in favor of trying to record everything.
- The closing slide asks students to assess what is vibrating in several different instruments: clarinet, trumpet, drum, flute, piano, guitar, violin. If you have access to these or other instruments, bring them into class. This closing section would be enhanced by having the real instruments on hand.
Teacher Tune-ups
Teaching Notes
ACTIVITY OVERVIEW
- Set the context for the activity: Feel the Hum (5 minutes)
- Illustrate how humans hear (5 minutes)
-
Choose one to nine stations to set up for your students (about 5–7 minutes per rotation)
- Sound Station #1: Electronic Oscillo-piano-scope (5 minutes)
- Sound Station #2: Straw Pipes of Pan Flute (5 minutes)
- Sound Station #3: Hydro-Xylophone (5 minutes)
- Sound Station #4: Making a VERY Old-School Telephone* (5 minutes)
- Sound Station #5: Pepper on the Dance Floor (5 minutes)
- Sound Station #6: Pluck the Stick* (5 minutes)
- Optional Additional Sound Station* (5 minutes)
- Review the stations (10 minutes)
Note: The starred (*) activities were developed in cooperation with Kate Maher of M.S. 20 in the Bronx—thank you!
Set the context for the activity: Feel the Hum (5 minutes)
Before sending the students to rotate through hands-on lab and demo stations, lead them in a shared class-wide activity.
Paraphrase:
The human body is equipped to make and sense sound vibrations. In this activity, we're going to make some qualitative observations about the sound we make when we talk and sing.
![]() Turn & Talk
Turn & Talk
What do you feel as you hum?
How did you create different pitches?
There's a vein not too far from your vocal cords. Why do we hear air vibrating the vocal cords amplified, but not our blood pulsing through our veins?
What's making the sound and how do we hear it?
Illustrate how humans hear (5 minutes)
![]()
When you hear a sound, what are you actually hearing?
How are sound waves of the human voice generated?
How are sound waves received by the human ear?
When you listen to music, have you ever thought about how your favorite song gets from the speakers to your ear? How does this model change when we're listening to music from a stereo?
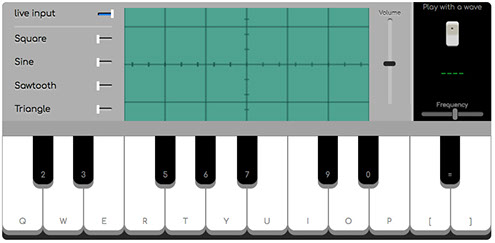
Sound Station #1: Electronic Oscillo-piano-scope (5–15 or more minutes)
Materials
![]()
![]()
Sound Station #2: Straw Pipes of Pan Flute (5 minutes)
Materials
- 7 straws (with 6 mm diameter)
- masking tape
- centimeter ruler
- permanent marker
Paraphrase:
Every sound is made when something vibrates. Sometimes it's the skin stretched across a drum, sometimes it's a plucked string. By fine tuning the amount of what is vibrated, you can make notes. At this station you'll make a full octave of eight notes.
![]()
Sound Station #3: Hydro-Xylophone (5 minutes)
Materials
- 8 identical tall, thin glasses or jars, preferably with vertical sides.
- pitcher or bucket with at least 6 cups of water
- pencil or wooden dowel to use as a mallet
- ruler
- towel for mopping up small spills (optional, but recommended!)
Paraphrase:
Every sound is made when something vibrates. Sometimes it's the skin stretched across a drum, sometimes it's a plucked string. By fine tuning the amount of what is vibrated, you can make notes. At this station you'll make a full octave of eight notes.
![]()
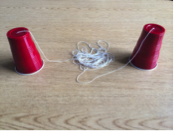
Sound Station #4: Making a VERY Old-School Telephone* (5 minutes)
Materials
- 2 cups
- 6 meters of string
- scissors
- nail (or other device for poking a small hole)
Paraphrase:
Sound waves are mechanical waves; they need a medium to transmit energy. When we clap our hands, the air between our hands gets compressed. The air molecules bump into each other, creating a vibration that travels through the air as a longitudinal or compression wave.
![]()
Preparation
- Measure and cut a 6-meter length of string.
- Using the nail, poke one small hole in the bottom of each cup.
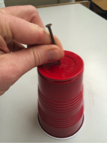
- Feed the string through the bottom of each cup and tie a large knot so that the string cannot pull out.
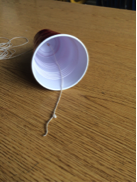
- After making a phone with a 6-meter length of string, you might try different lengths of string so students can see how the length affects the effectiveness of the phone.
Sound Station #5: Pepper on the Dance Floor (5 minutes)
Students may be familiar with the sound heard from a passing car whose stereo has the bass set so high and the volume so loud that the neighborhood windows shake. A similar transfer of energy is easy to see with a small boom box and some pepper sprinkled on paper.
For a more ambitious demo, consider building a Chladni Plate or at least watching a video of them in action.
Materials
- media player with a decently loud speaker (such as a boom box)
- balloon
- paper plate
- pepper
![]()
Sound Station #6: Pluck the Stick* (5 minutes)
Materials
- metric ruler
Paraphrase:
Every sound is made when something vibrates. Sometimes it's the skin stretched across a drum, sometimes it's a plucked string. By fine tuning the amount of what is vibrated, you can make notes of different pitches. Students adjust the pitch of a simple musical instrument by changing the amount of freely moving wood that gets plucked.
![]()
Optional Additional Sound Station* (5 minutes)
Add other optional sound stations if you have the materials for these higher-end physics demos: tuning forks and resonance boxes.
Caution the students to use the tuning forks gently:
Do your best to avoid dropping your tuning forks. They are very easy to break. They are very delicate. Hold them only by the handle, and strike them only against rubber: if you don't have a sounding block, some science teachers and their students have used the sole of their shoe as a striking surface.
Materials
- up to 4 tuning forks
- rubber or soft wooden block for striking tuning forks (important: forks break easily when struck against hard surfaces)
- table tennis ball (usually known as a "Ping Pong® ball") attached to about 1 foot (30 cm) of string and hanging from a stand or off the side of a table where it can move freely
- 2 resonance boxes
- weight
- ruler (optional—for measuring an approximate distance)
- a shallow tray of water (like a food service container)
Paraphrase:
Resonance boxes and tuning forks make it possible to hear a usually undetectable phenomenon: waves transferring energy from one medium to another. They can be quite expensive, however, and you may be able to demonstrate a similar phenomenon by simply bringing the vibrating end of a tuning fork close to the surface of some water, and touching it to the surface.
![]()
Review the stations (10 minutes)
Ask:
What did the different stations have in common? How were they different?
Paraphrase:
Musical instruments, including those we used today, produce sounds when some part of them is vibrated.
Ask:
What is vibrating when these instruments make sound?
- clarinet (the reed)
- trumpet (the lips of its player)
- drum (its head)
- flute (the air inside the flute)
- piano (strings inside the body of the piano that the hammers hit)
- guitar (strings)
- violin (strings)
![]() What's vibrating?
What's vibrating?
clarinet
trumpet
drum
flute
piano
guitar
violin
BETA Version - Please send comments and corrections to info@serpinstitute.org
![]()
![]() This project was supported by Science Sandbox, a Simons Foundation initiative dedicated to engaging everyone with the process of science.
This project was supported by Science Sandbox, a Simons Foundation initiative dedicated to engaging everyone with the process of science.
Strategic Education Research Partnership
1100 Connecticut Ave NW Suite 1310 • Washington, DC 20036 • (202) 223-8555
info@serpinstitute.org